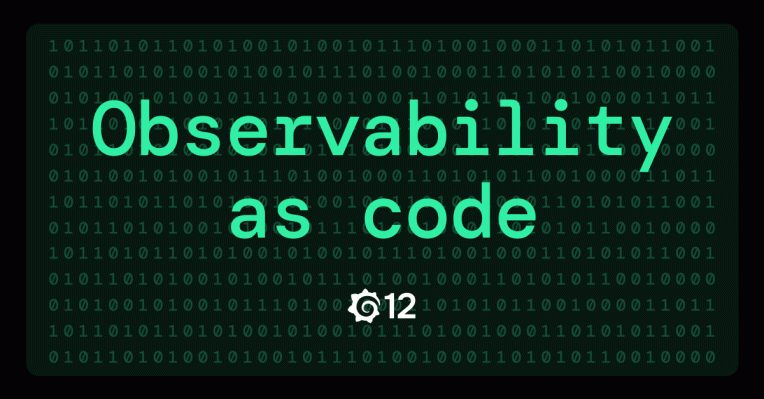
The world of observability just took a major leap forward. With the release of Grafana 12, Grafana Labs is not just rolling out new features—they’re reshaping how teams visualize, manage, and automate their observability data. This version brings cutting-edge capabilities like Git Sync, dynamic dashboards, enhanced Drilldown apps, and a Cloud Migration Assistant, all aimed at making observability more flexible, performant, and developer-friendly.
As the demand for seamless, scalable monitoring solutions grows, Grafana 12 positions itself as a pivotal release for teams adopting cloud-native architectures, GitOps practices, and platform engineering models.
Git Sync: Observability-as-Code Becomes a Reality
One of the most revolutionary features in Grafana 12 is the introduction of Git Sync—a game-changer for teams wanting to manage Grafana dashboards and folders as code.
Git Sync allows users to mirror dashboard configurations to a Git repository directly from the Grafana UI. This eliminates the manual friction of exporting/importing JSON files or using CLI-based scripts for version control. Instead, users can now track changes, collaborate via pull requests, and maintain an auditable history—all integrated within their existing GitOps workflows.
In an interview during GrafanaCON 2025, Torkel Ödegaard, the creator of Grafana, highlighted how Git Sync addresses a long-standing challenge: “People who tried to manage dashboards as code often lost the ease and flexibility of editing dashboards in the UI. Git Sync solves that.” By combining the best of both worlds—code-based management and intuitive UI editing—Grafana 12 provides a robust foundation for true observability-as-code.
Dynamic Dashboards: Smarter Layouts, Better Context
Grafana dashboards are known for their flexibility, and Grafana 12 elevates this further with dynamic dashboards, currently available in experimental mode. These are not just static views with graphs—they’re context-aware, responsive, and intelligent dashboards that adapt to your data and user interactions.
Key dynamic dashboard capabilities include:
- Contextual Tabs: Switch between different data views based on selected variables or user inputs.
- Conditional Rendering: Show or hide panels dynamically depending on thresholds, environments, or custom logic.
- Auto-Grid Layouts: Responsive grid systems that automatically reorganize panels based on screen size and content density.
These features empower teams to build dashboards that adjust in real-time, reduce visual clutter, and provide highly relevant insights for specific operational contexts. Whether you’re debugging a production issue or reporting on service health, dynamic dashboards make Grafana feel more like a smart assistant than a static tool.
Drilldown Apps: Instant Insight Without the Code
Grafana 12 also marks the general availability of its Drilldown apps—powerful tools for exploring Logs, Metrics, and Traces without writing complex queries.
Traces Drilldown
Visualize Tempo trace data and associated RED metrics automatically. This helps users identify performance bottlenecks, slow transactions, or cascading failures in microservices architectures. No TraceQL knowledge needed.
Metrics Drilldown
Offers refined filtering with prefix/suffix options, label-based grouping, and sorting based on recency, dashboard association, or alert relevance. This makes it easier to manage hundreds of metrics without losing context or precision.
Logs Drilldown
Now supports regex filtering, multiple inclusion filters, and a new JSON visualizer, enabling faster root cause analysis from raw logs. Parsing and interpreting structured logs becomes a lot simpler, especially when dealing with deeply nested JSON data.
All Drilldown apps are designed for point-and-click investigations, letting teams go from symptoms to root causes with minimal effort. These tools bridge the gap between high-level dashboards and detailed diagnostics, turning Grafana into a full-fledged incident response environment.
Investigations: Unified Views Across Data Types
Building on the power of Drilldowns, Grafana 12 introduces Investigations—a feature that lets users add panels from Traces, Logs, and Metrics into a single, unified view. This dramatically speeds up the process of finding correlations across different observability signals.
For example, during a latency spike, users can bring together:
- A trace of the slow API call
- Logs related to the request ID
- Metrics showing CPU or memory anomalies
By eliminating the need to jump between dashboards or tools, Investigations makes Grafana a single pane of glass for observability troubleshooting. It’s especially beneficial in high-pressure situations like production incidents or service outages.
Cloud Migration Assistant: From OSS to Grafana Cloud, Effortlessly
Grafana 12 also makes cloud adoption easier with the Cloud Migration Assistant, now generally available. This tool automates the process of migrating configurations, dashboards, and data sources from OSS or Enterprise Grafana setups to Grafana Cloud.
Users can:
- Select specific resources to migrate
- Track results in a sortable, filterable table
- Validate what was successfully migrated and what needs attention
This feature is a big win for organizations scaling their observability across teams, regions, or business units, and looking to leverage the elasticity, security, and integrations that Grafana Cloud offers.
Performance Upgrades and Preview Features
Grafana 12 is not just feature-rich—it’s fast. Thanks to a migration to react-data-grid, the updated table visualisation offers a 97.8% improvement in CPU performance when rendering large datasets. This is crucial for users who rely on tables to review logs, metrics, or audit trails.
Other notable additions include:
- New UI themes to improve accessibility and customisation.
- SCIM provisioning (public preview) for Enterprise/Cloud Advanced users to manage user identities more efficiently.
- SQL Expressions (private preview) enabling advanced, multi-source queries without needing external ETL tools.
These features show that Grafana is not only evolving in terms of capability but also in performance, extensibility, and administrative control.
Looking Ahead: AI Assistant on the Horizon
Ödegaard also teased an exciting new development: Grafana is actively working on an AI Assistant to enhance usability and onboarding. This assistant will help users understand observability concepts, suggest dashboard improvements, assist in troubleshooting, and even generate queries or visualisations based on natural language prompts.
The goal is to “level up every Grafana user”, making observability expertise more accessible and reducing time-to-value for teams new to the platform.
Breaking Changes to Keep in Mind
While Grafana 12 brings immense value, it also introduces a few breaking changes:
- Angular plugin support has been removed, as part of an effort to modernize the plugin ecosystem.
- Stricter data source configuration rules may require updates to existing setups, especially for teams migrating from older versions.
Users are encouraged to review the full changelog and migration notes before upgrading production environments.
Final Thoughts
Grafana 12 represents a monumental step toward modern, scalable, and collaborative observability. It’s not just about pretty dashboards anymore—it’s about making observability automated, codified, and deeply integrated into the way teams build and operate software.
Whether you’re excited about Git Sync for version control, dynamic dashboards for smarter visualization, Drilldowns for real-time investigation, or the AI assistant on the horizon—Grafana 12 has something for every user.
As AWS’s Guillermo Ruiz put it: “Not marketing fluff. This one hits hard for platform engineers and anyone serious about observability.”
Know More : InfoQ
Follow us for more Updates